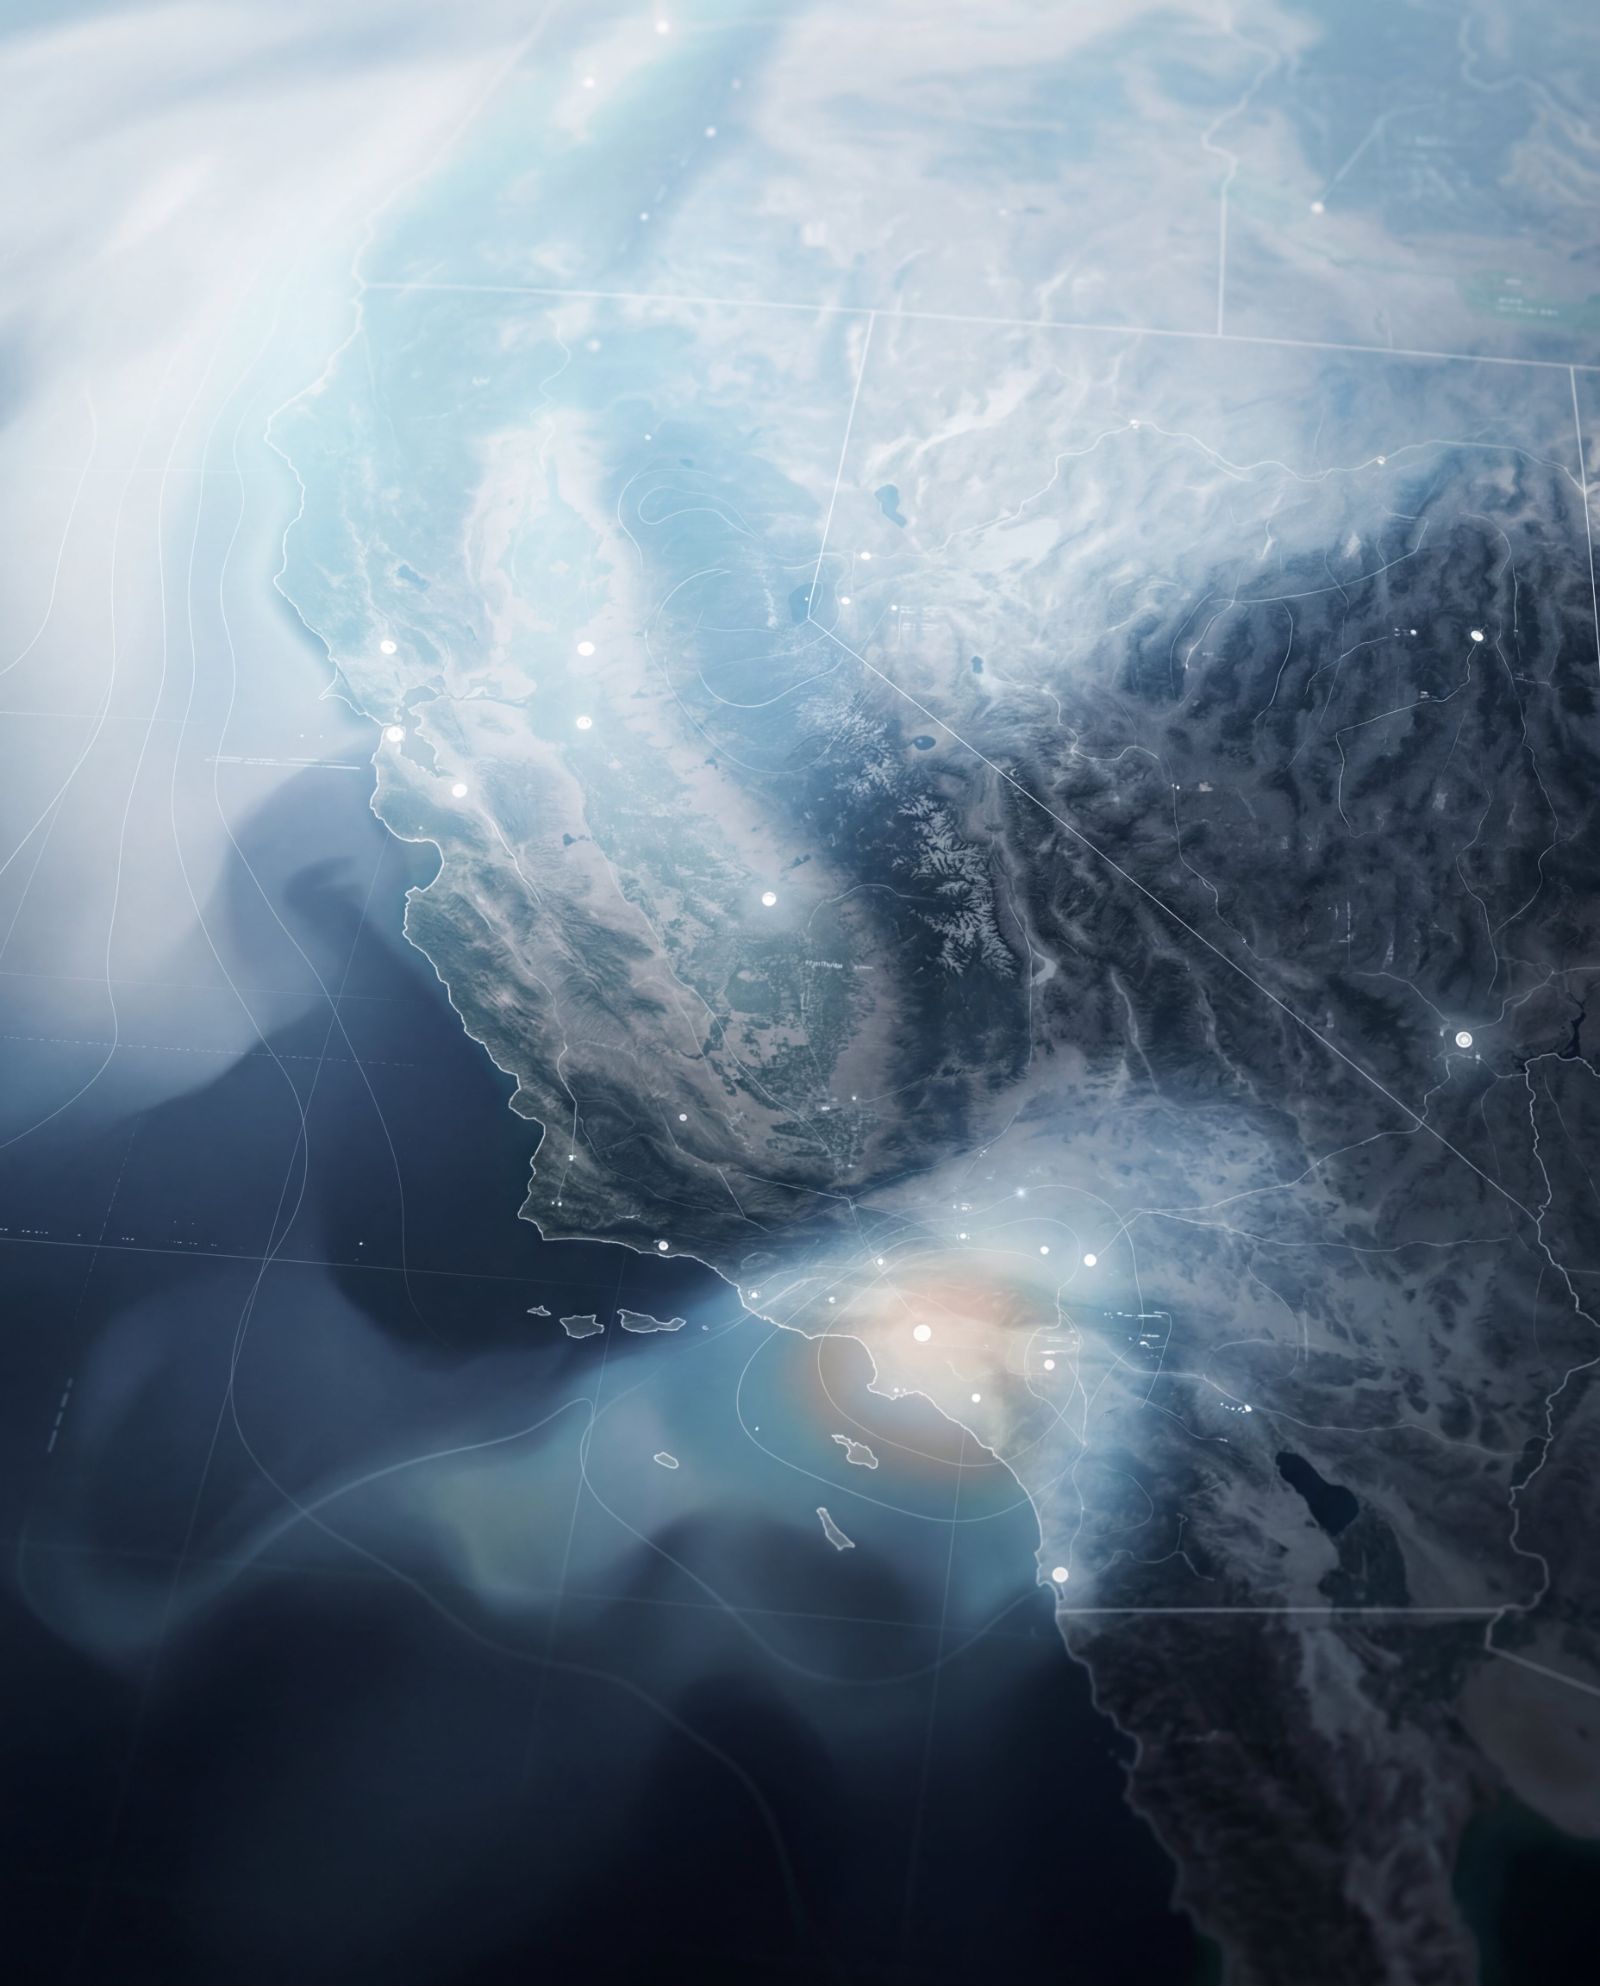
Atmospheric observatory visualization
Live Observatory • Atmospheric Monitoring

A clearer view of air quality across the planet

Track pollutant movement, regional exposure, and atmospheric change through a live observational layer built for environmental intelligence.

System Snapshot
Live Sync
186
Monitored Regions

Synchronized geographic zones under active atmospheric observation.

24/7
Live Signal Refresh

Continuous updates across pollutant movement, density shifts, and exposure signals.

9.2M
Data Points Daily

Environmental streams processed into a unified live observatory layer.

Observed Layers

Monitor the layers that shape air quality

From particulate density to regional drift, the observatory translates distributed atmospheric signals into a precise live system view across monitored zones.

Atmospheric particulate visual
LYR-01 Active

Particulate Matter

Track PM2.5 and PM10 concentrations across active regions with density shifts and historical comparison layers.

Network
186
Monitored Regions

Synchronized environmental zones under active atmospheric observation.

Drift Layer

The observatory models how airborne pollutants propagate across monitored regions, identifying transport corridors, directional shifts, and evolving cross-border exposure.

Updated continuously • forecast-weighted layer

Sensor confidence and atmospheric field
9.2 M

Data Points Daily

Environmental streams processed into a unified observatory layer.

Regional exposure observatory
Regional Exposure Live model

Regional Exposure Index

Map composite air-quality risk by geography, density, and atmospheric intensity to identify zones where conditions may carry the greatest operational impact.

population-weighted overlay
Atmospheric map background
Global View

A live map of atmospheric conditions

A continuously updated environmental layer showing pollutant movement, sensor activity, and emerging air-quality events across connected regions.

Global atmospheric state

Observe concentration, drift, and environmental intensity across connected monitoring regions.

Active Regions 186
North America West exposure-weighted
Central Europe stable confidence
South Asia Corridor elevated drift
Active Events
34 live
Forecast Interval
6 min SYNCED
Live atmospheric conditions map
Drift model updated for North Pacific transition zone

Regional exposure console

Analyze risk conditions, intensity shifts, and localized atmospheric anomalies across monitored zones.

REGIONAL_SCAN::LIVE
Event Log 2 ACTIVE
Elevated particulate drift
1m ago
Regional spread intensity rising across monitored corridor.
Sensor confidence realigned
4m ago
Calibration shift confirmed across weighted signal zones.
Forecast layer stabilized
12m ago
Short-range exposure model returned to nominal confidence.
Automation Rules
On anomaly Auto-isolate
Automated response policy active. 24 monitored transitions stabilized without manual intervention this week.
System Event Log
Drift update cycle complete 10:42 AM
Exposure model synchronized 09:15 AM
Scheduled calibration routine 02:00 AM
Infra Health
85 SCORE
CPU Allocation Stable
Memory Usage 82%
System Logic

From distributed sensing to environmental clarity

The observatory transforms fragmented atmospheric inputs into a unified operational view that can be monitored, interpreted, and acted on.

Collect stage environmental sensing

Collect

Aggregate live environmental streams from sensor networks, satellite layers, and regional measurements to establish a unified observational input layer.

Explore methodology
Operational Value

Built for decisions that depend on cleaner signals

Environmental visibility matters most when conditions are changing quickly. This section shows how the observatory turns cleaner atmospheric signals into earlier detection, stronger forecasting, and more confident response planning.

Outcome 01

Earlier detection with clearer environmental signals

Detect meaningful air-quality shifts before regional conditions fully intensify, reducing lag between signal emergence and operational awareness.

Operational Impact
MT
Monitoring teams
Earlier anomaly recognition
Atmospheric operational visibility
Regional Visibility

Sharper visibility across evolving exposure zones

Understand where atmospheric pressure is building, how it is spreading, and which monitored regions require closer attention.

Live Observability
Forecast Reliability Operational response confidence
3.4 ×

Broader regional visibility across layered atmospheric conditions and monitored shifts.

Response Planning

Move from isolated measurements to clearer response planning with live context, forecast visibility, and stronger operational confidence.

Earlier anomaly recognition
Sharper regional prioritization
Built for environmental intelligence teams
Atmospheric observatory background